Democracy Viewer
01 — HOME
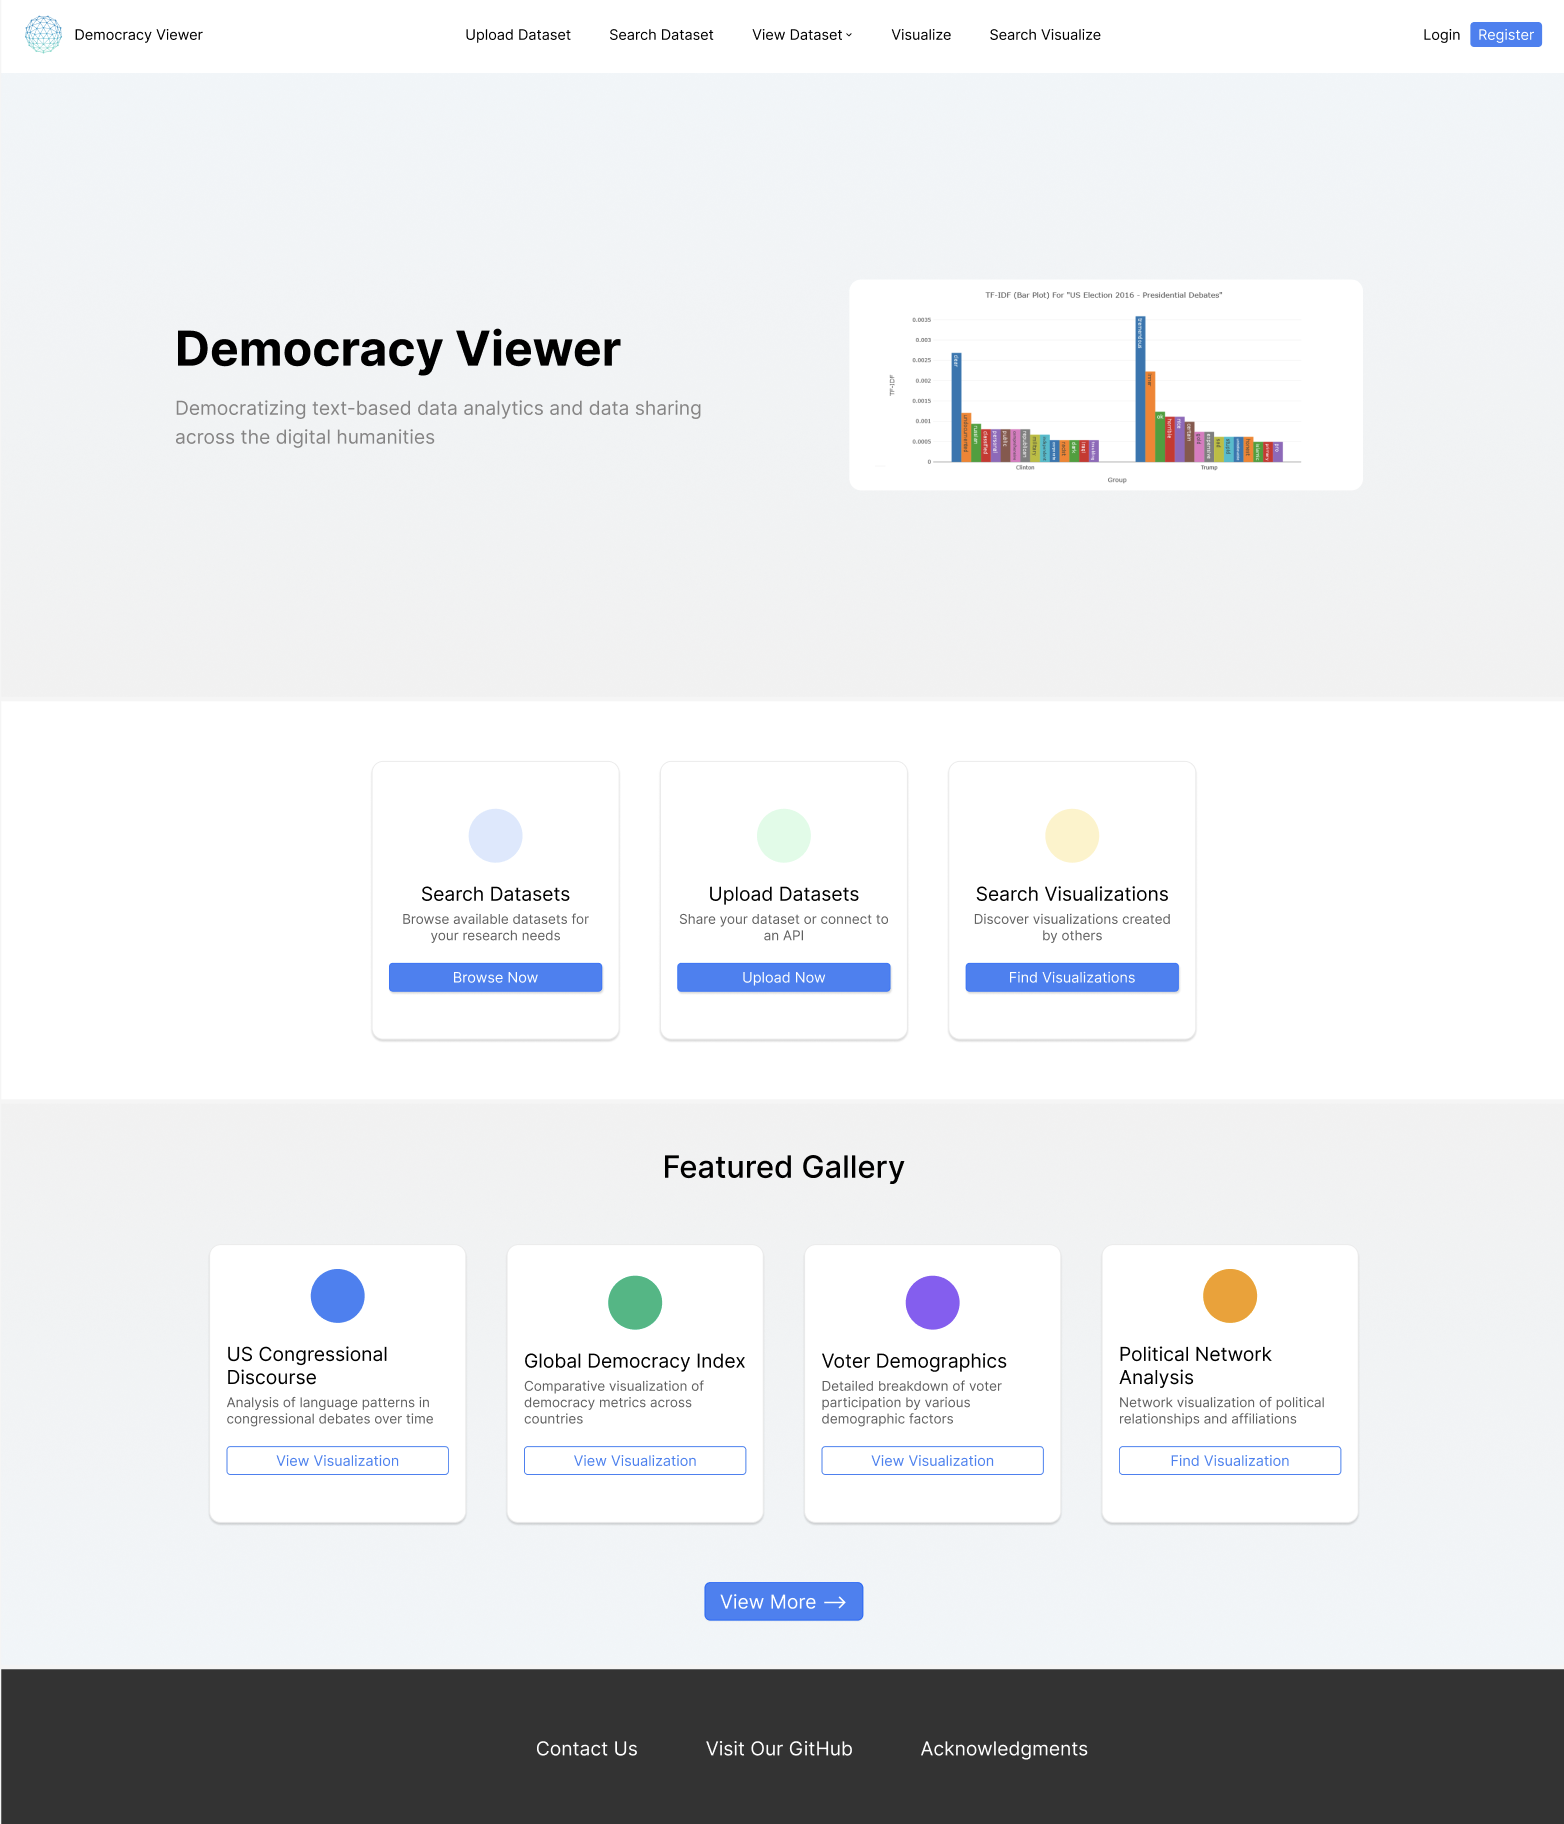
Democracy Viewer is an open-access platform designed to democratize text-based data analytics across the humanities and social sciences. Built by a multidisciplinary team of students and researchers at Southern Methodist University and Emory University, it allows anyone — from seasoned academics to first-time data explorers — to upload, search, and visualize large text datasets without needing a background in computer science or data analysis. What makes Democracy Viewer unique is its commitment to accessibility: every tool on the platform is built with non-technical users in mind, turning complex statistical text analysis methods into approachable, interactive experiences.
The home page serves as a welcoming entry point into everything the platform has to offer. A dynamic hero image cycling through three distinct data visualizations sets the tone from the moment users arrive — immediately demonstrating the quality and range of insights Democracy Viewer can surface. Three feature cards give users an immediate, intuitive path forward to navigate the key features of our platform— whether they want to browse the existing dataset library, contribute their own data, or explore visualizations created by the community. Below, a Featured Gallery highlights a curated selection of standout visualizations from the community, sparking curiosity and demonstrating the breadth of research topics the platform is capable of supporting. As part of the broader design team, I contributed to refining the home page's layout and visual direction — improving clarity, consistency, and overall user experience to better reflect the platform's mission of making data accessible to all.
The designs presented here reflect my most current Figma wireframes for the platform; as an actively developed project, not all proposed changes have been fully implemented in the live site at this time. To explore Democracy Viewer firsthand, visit democracyviewer.com.
02 — VISUALIZE
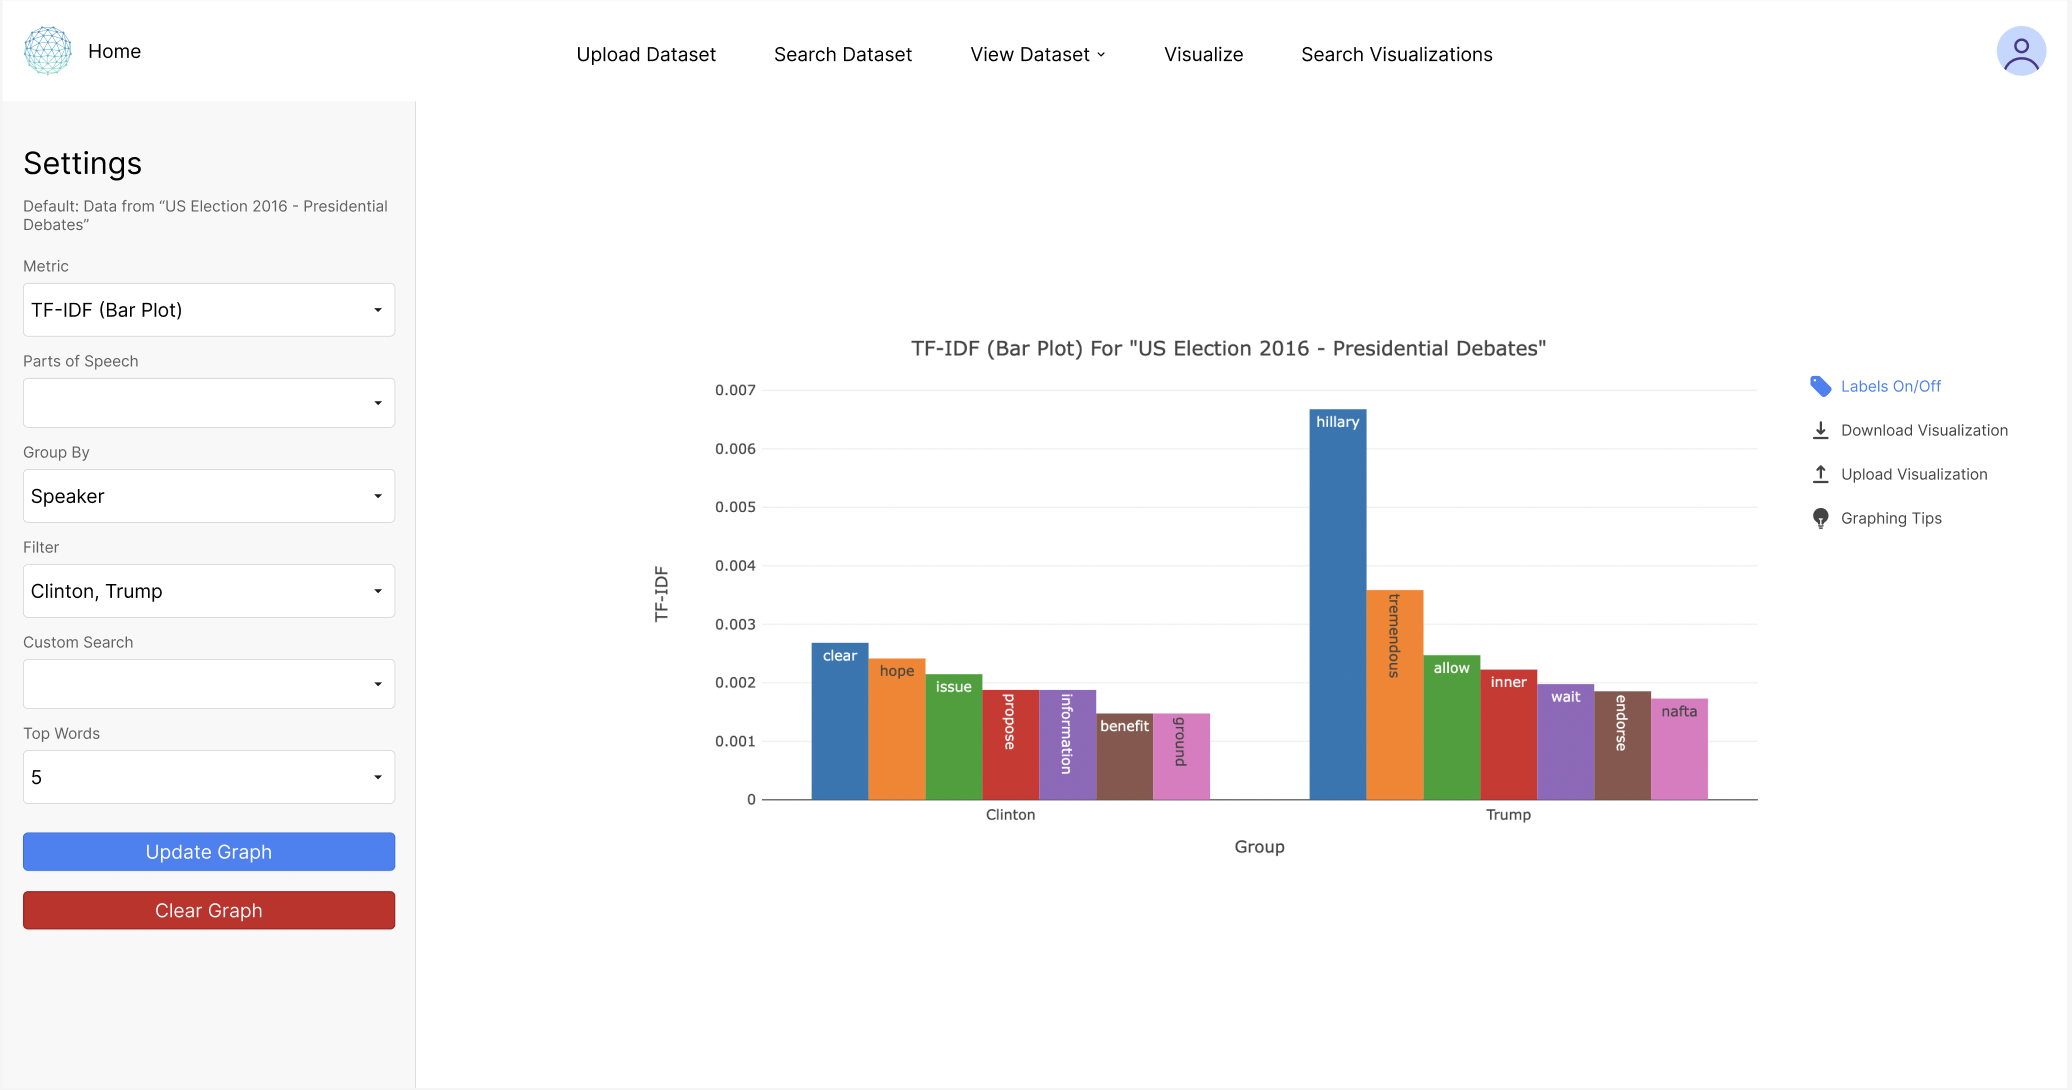
I am currently working to design a built-in Guided Mode that overlays step-by-step instructions directly on the page, making the tool accessible to researchers without a data science background. Guided mode is especially helpful for new users, but it is optional and can be easily toggled off.
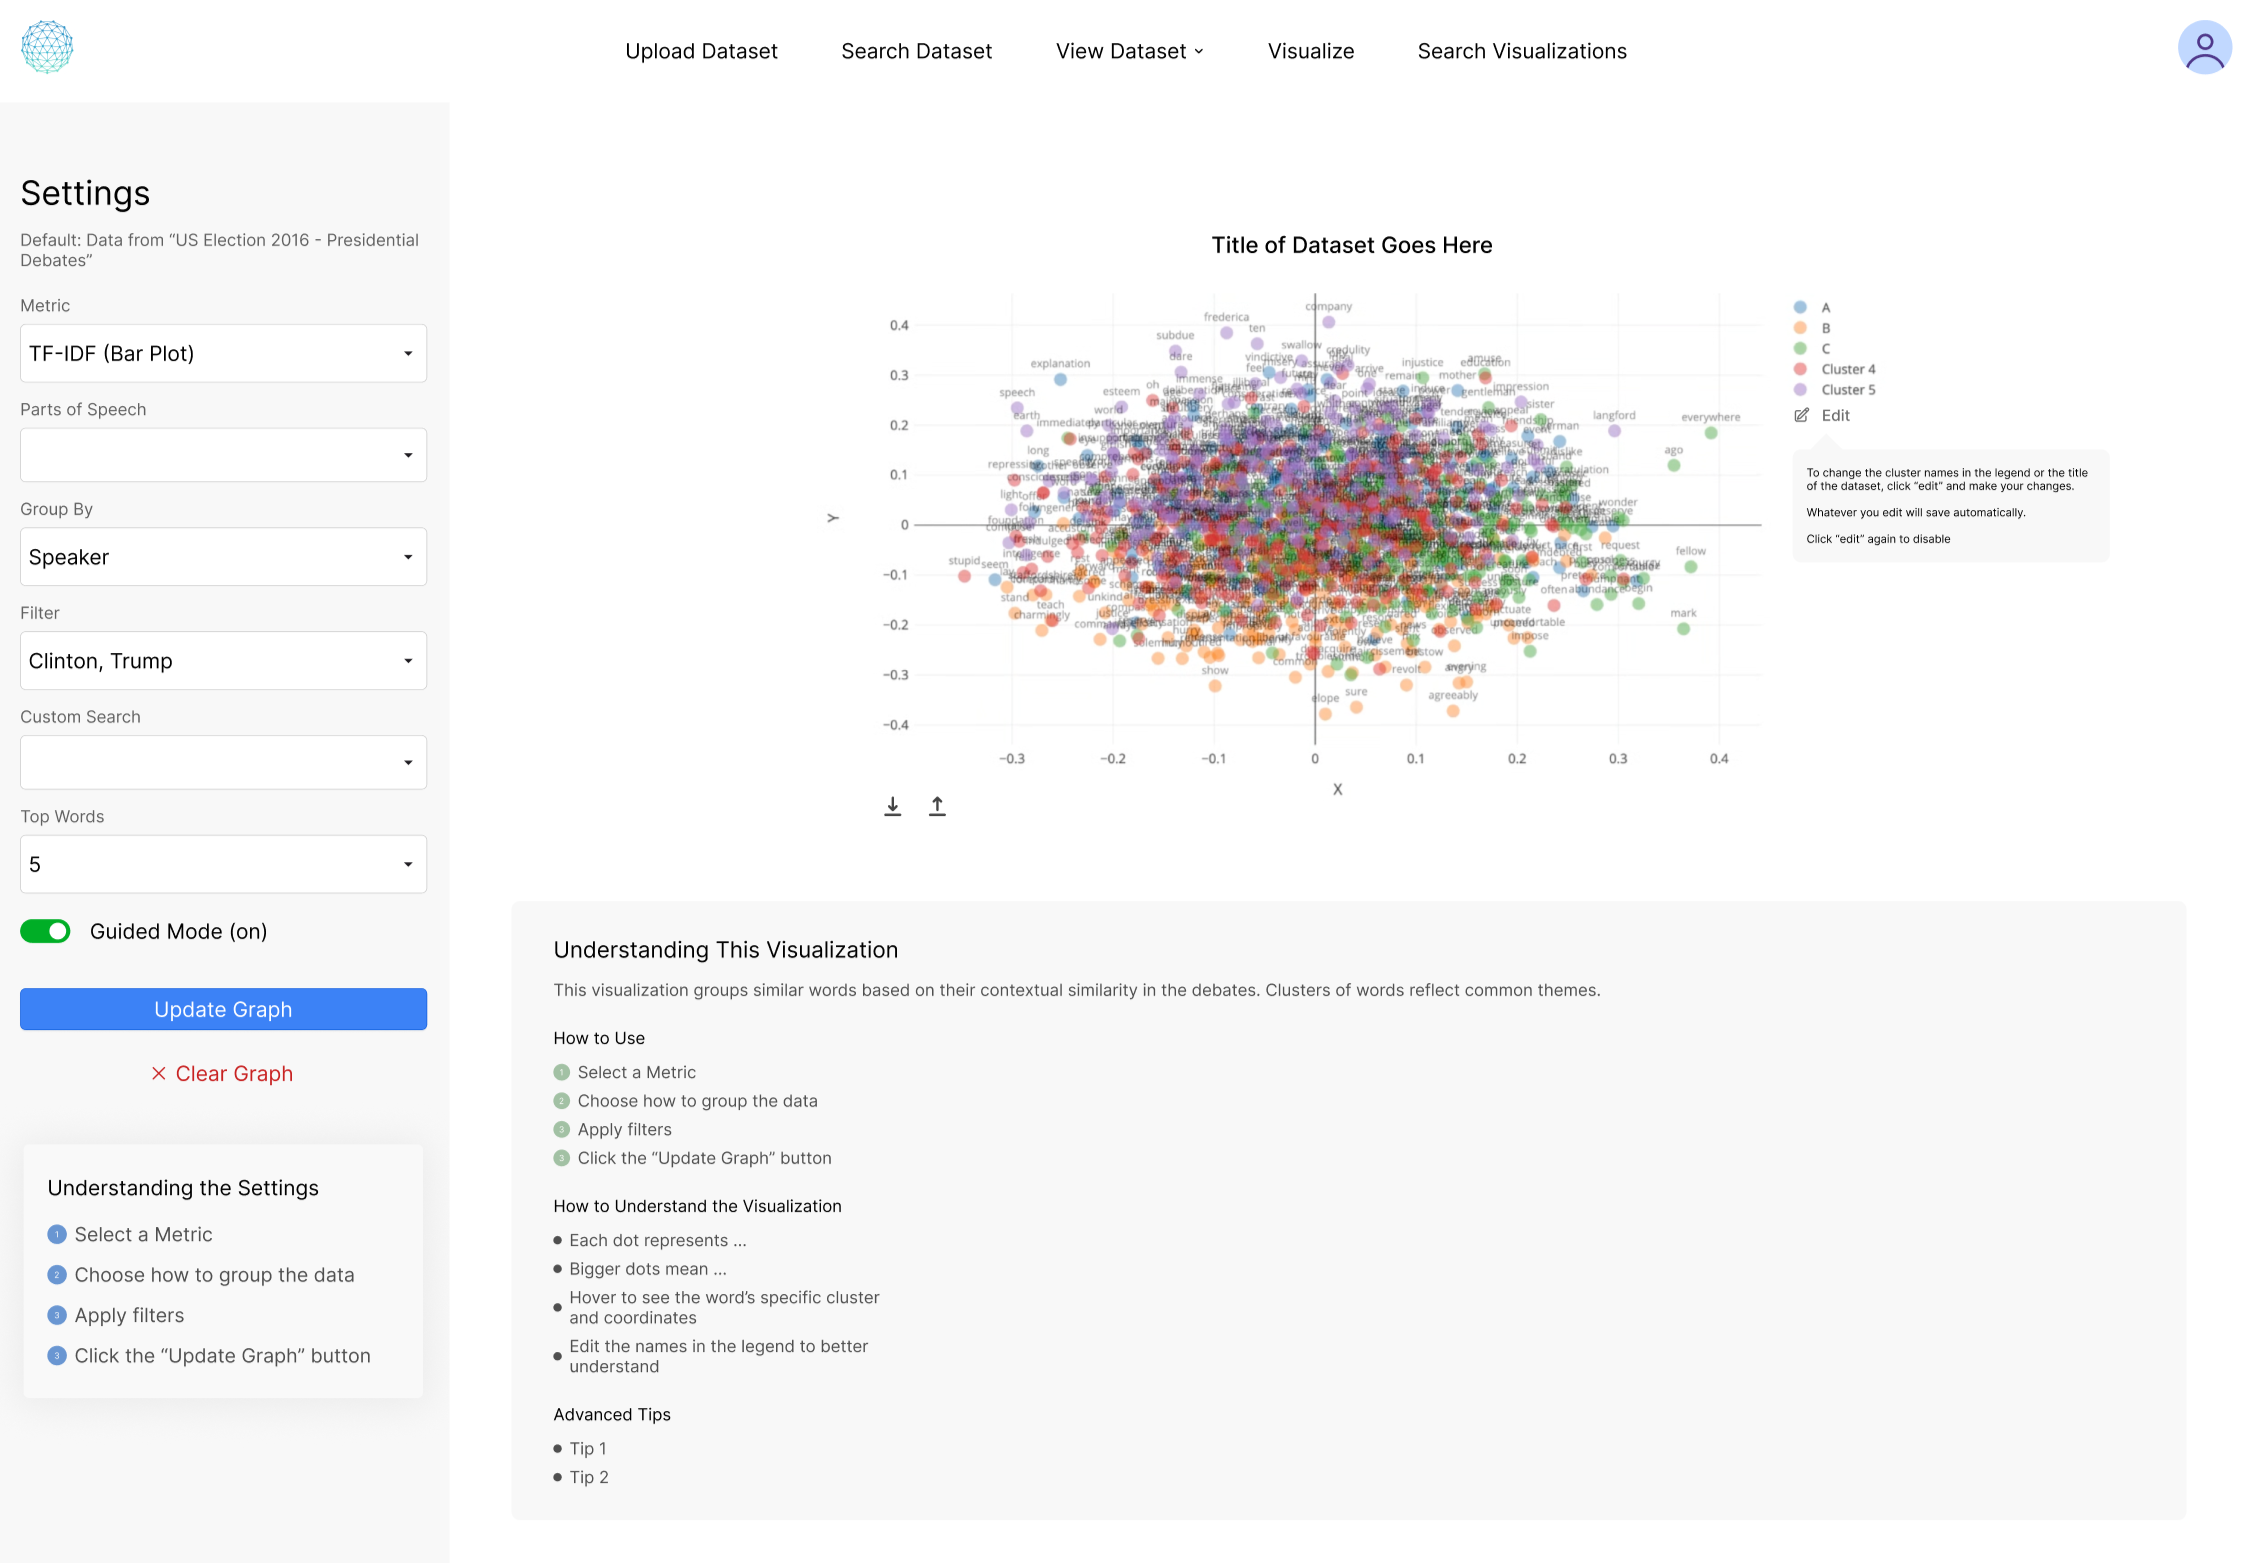
The Visualize page is the core of Democracy Viewer, letting researchers generate custom charts from any uploaded or searched dataset. Users configure their analysis through a settings panel — selecting a metric, grouping by variables, and applying filters — then render the results as an interactive plot best suited for the dataset. The user is able to adjust the labels, zoom in and out to inspect data, download, and upload their visualizations for better understanding and collaboration.
03 — AUTHENTICATION & UPLOAD
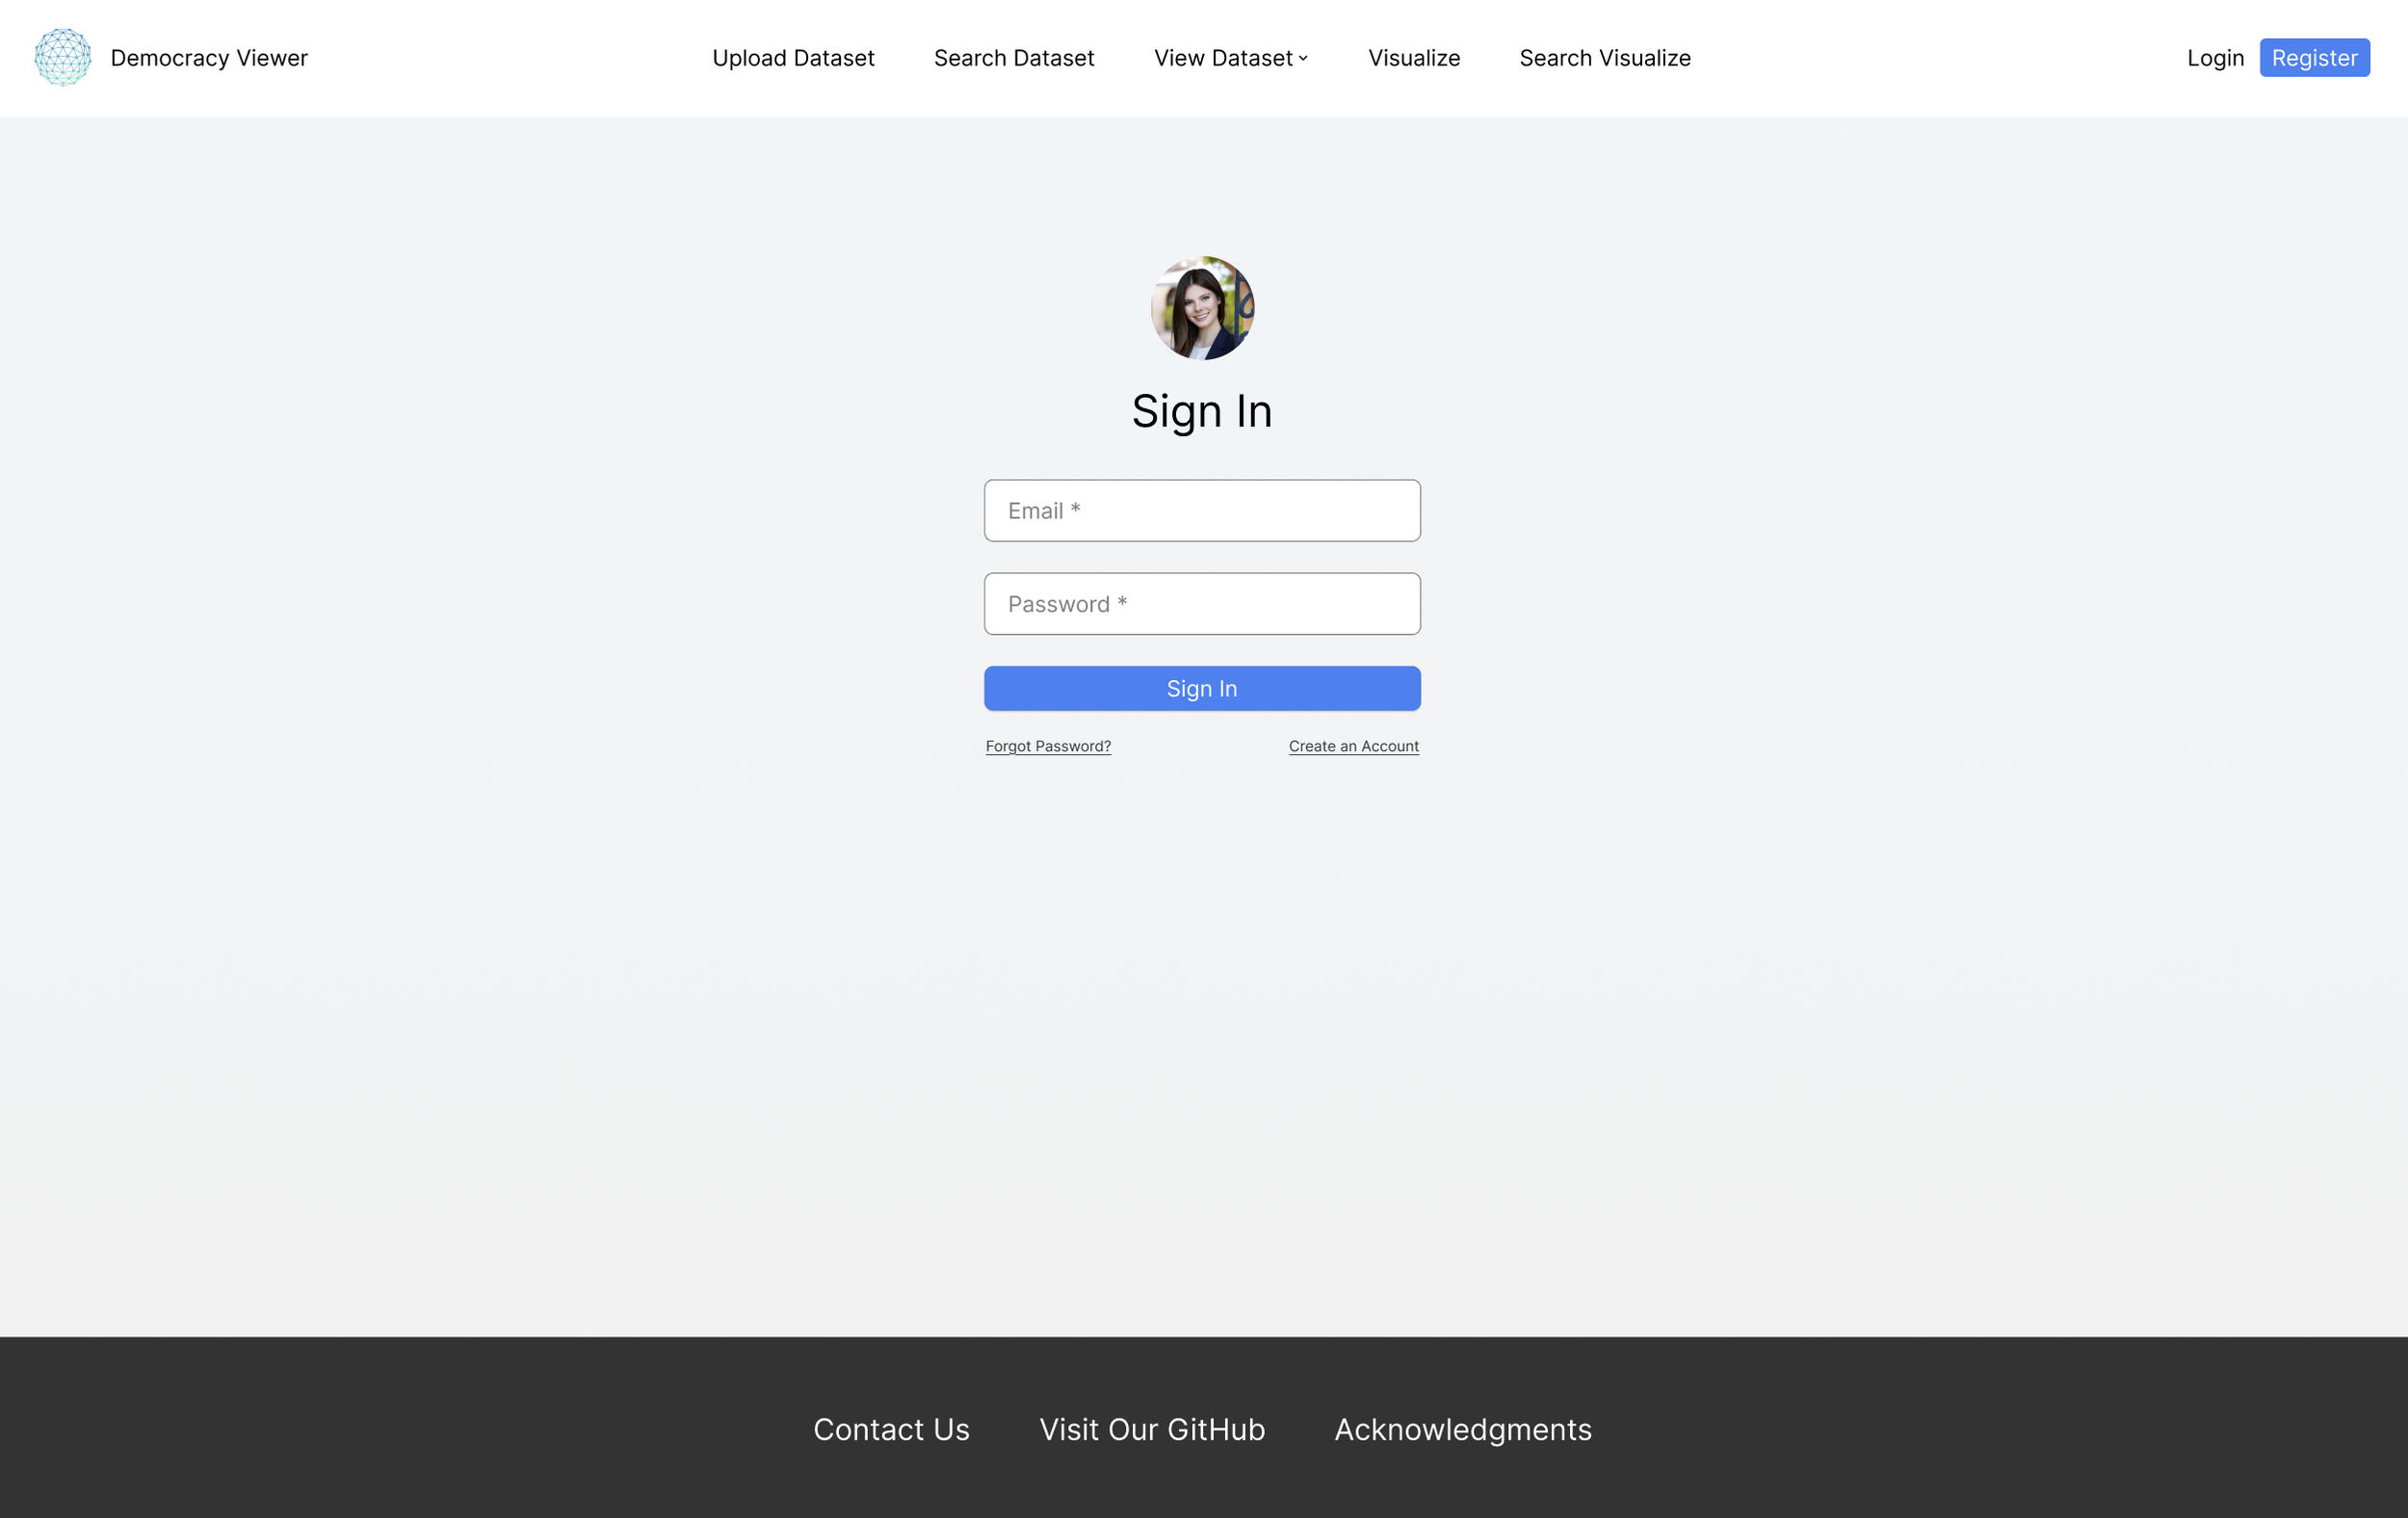
Sign In Page
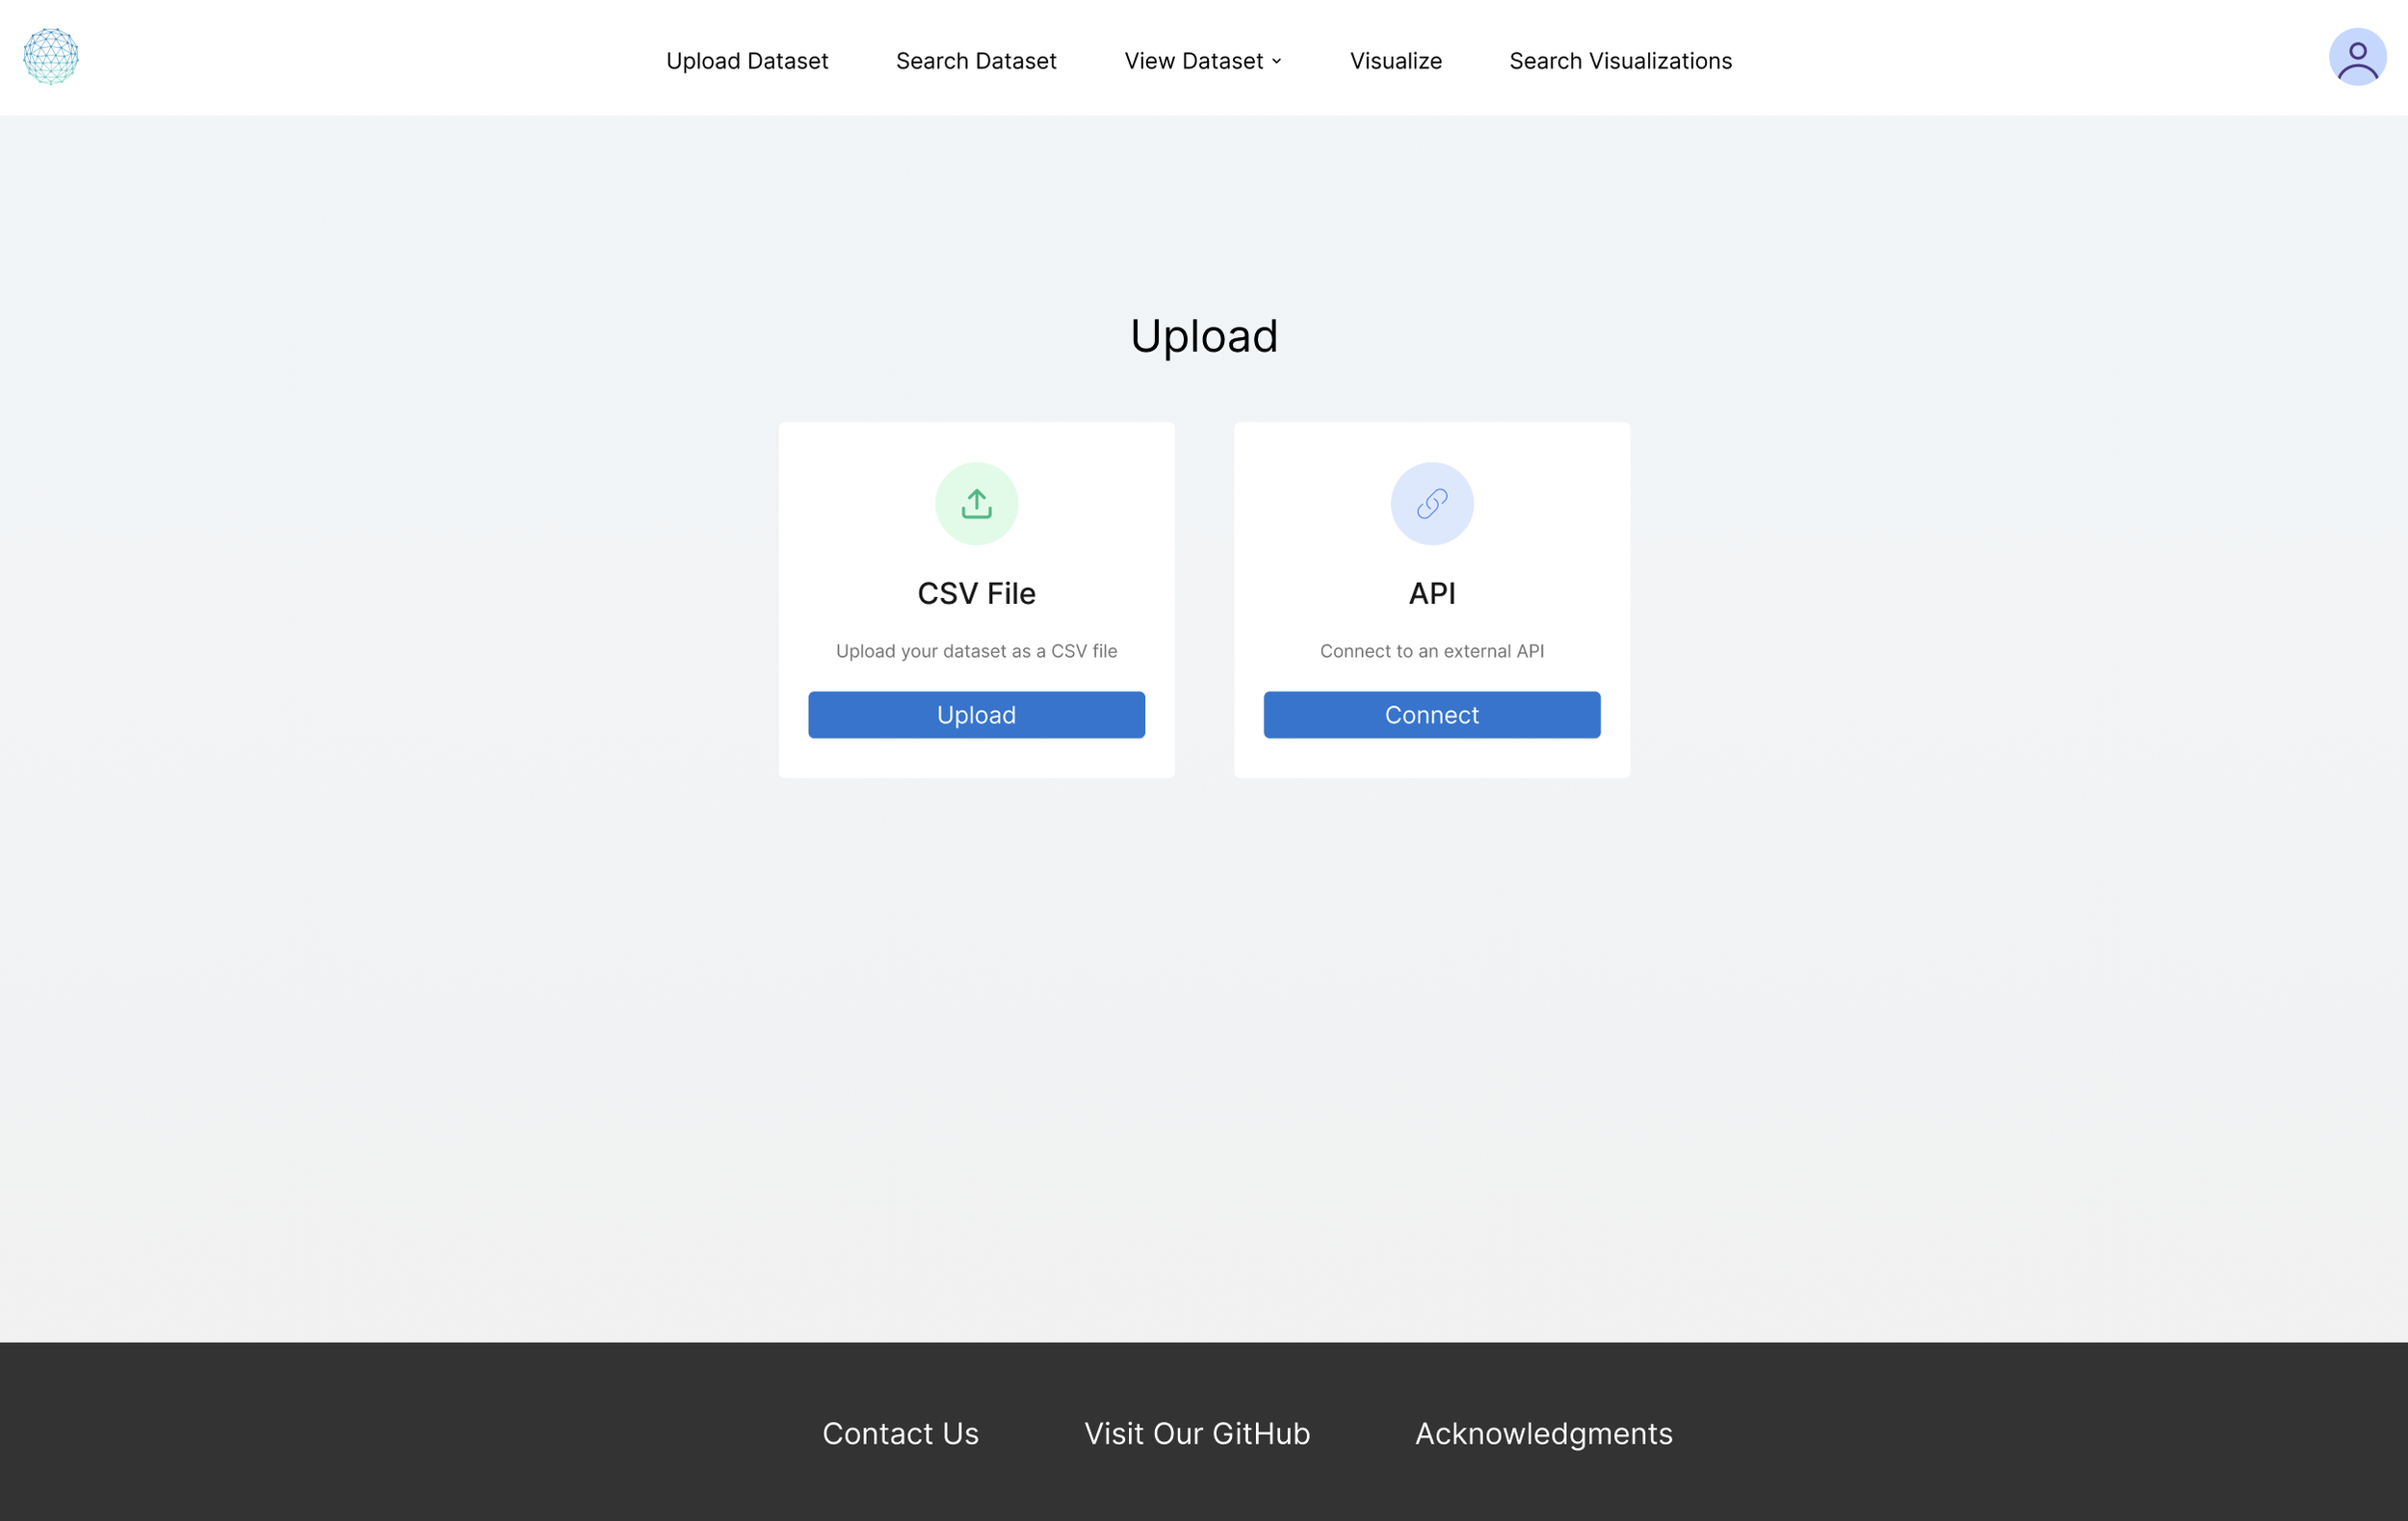
Upload Dataset Page
04 — SEARCH
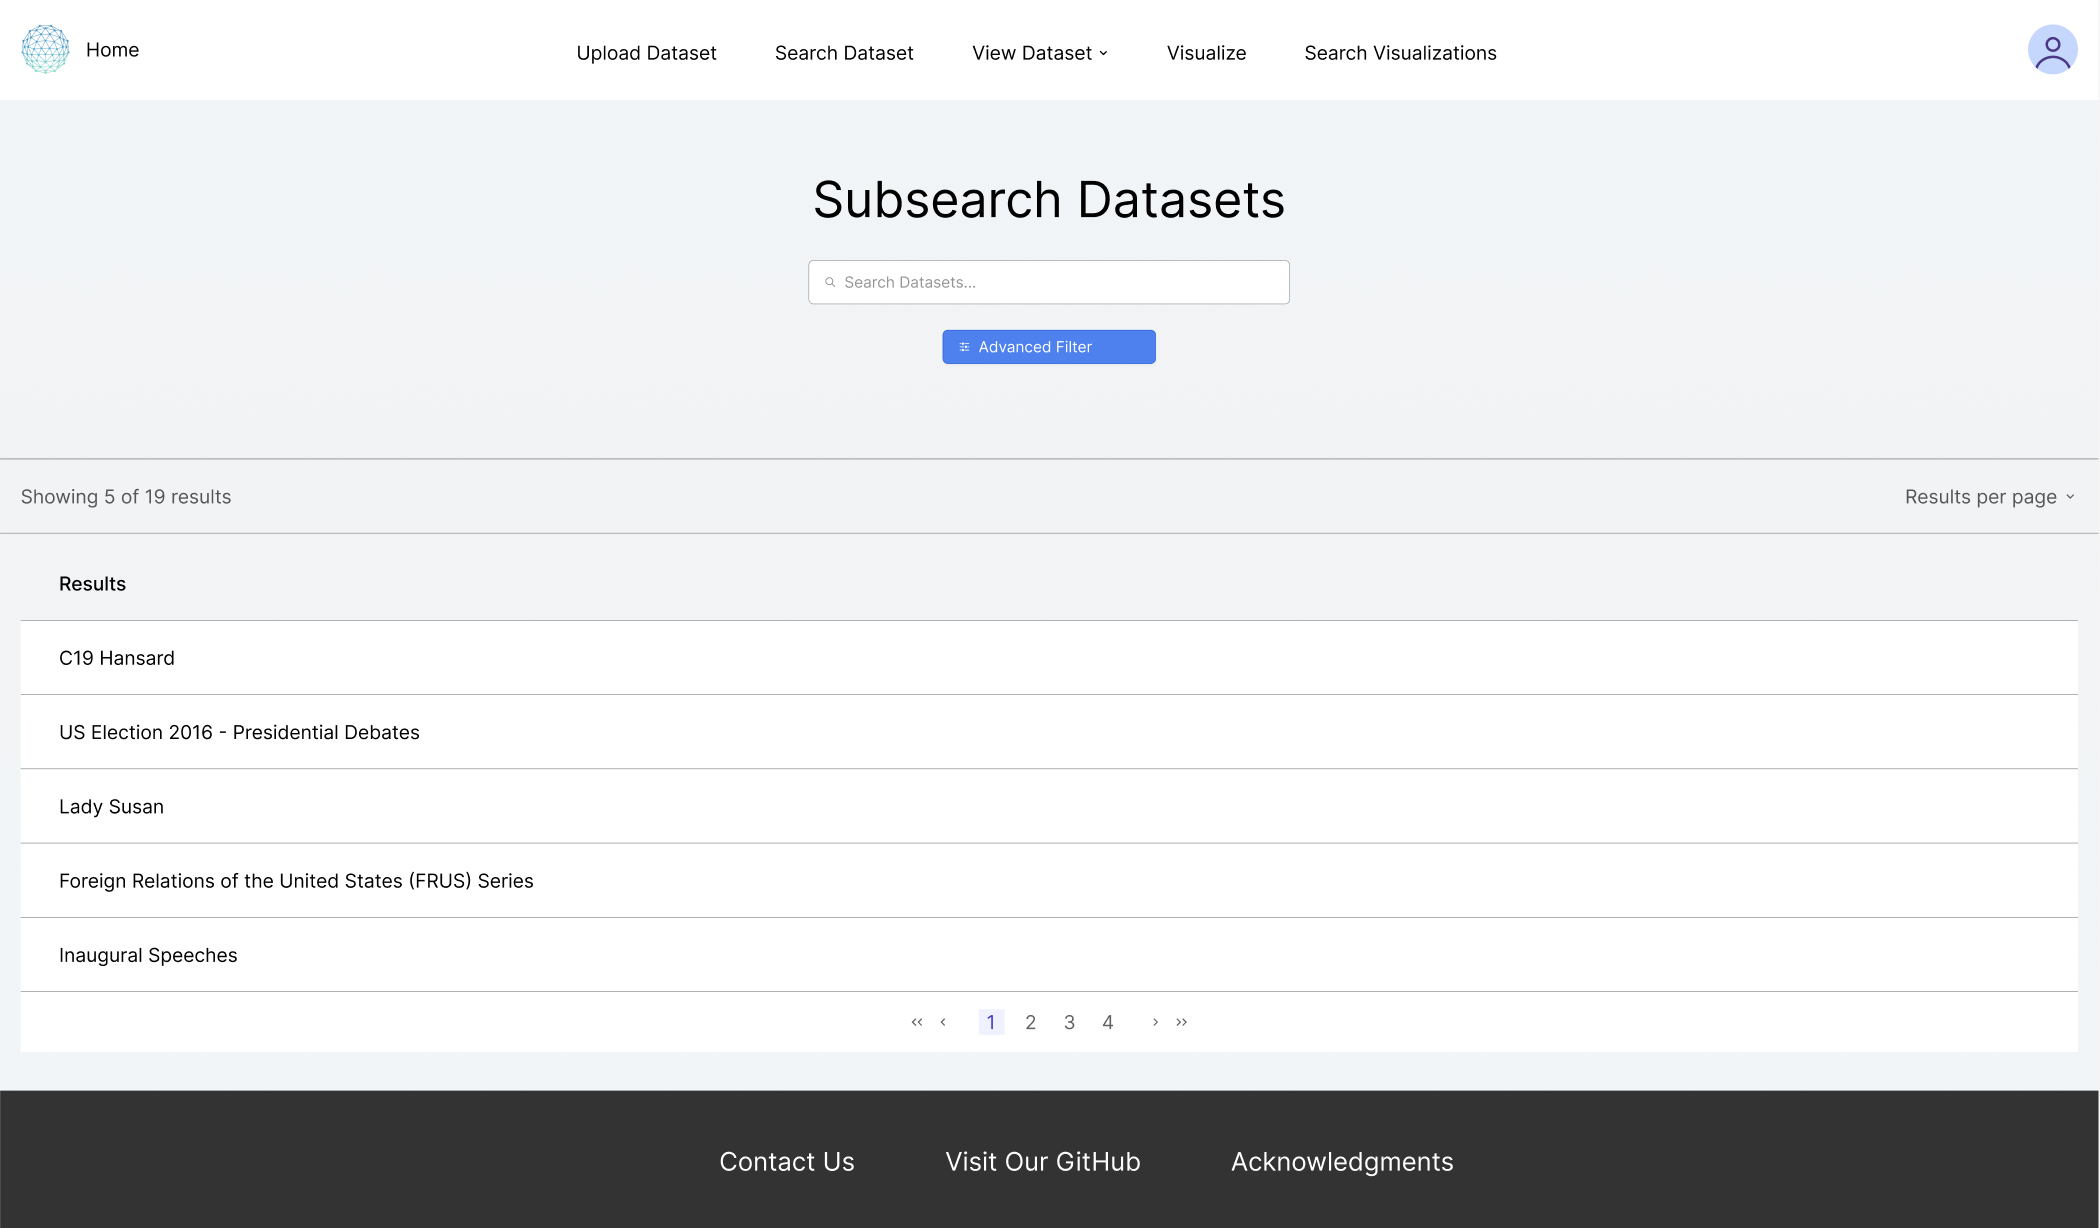
The Subsearch Datasets page allows researchers to browse and filter the platform's growing library of text-based datasets. Users can search by keyword or open the Advanced Filter to narrow results by title, description, owner, privacy setting, or tags. The page supports both the public dataset library and a user's own uploaded datasets, making it a unified hub for finding and revisiting data relevant to their research. My redesign refines the layout and filter interface to feel more intuitive and visually consistent with the rest of the platform.
05 — ACKNOWLEDGMENTS & TEAM
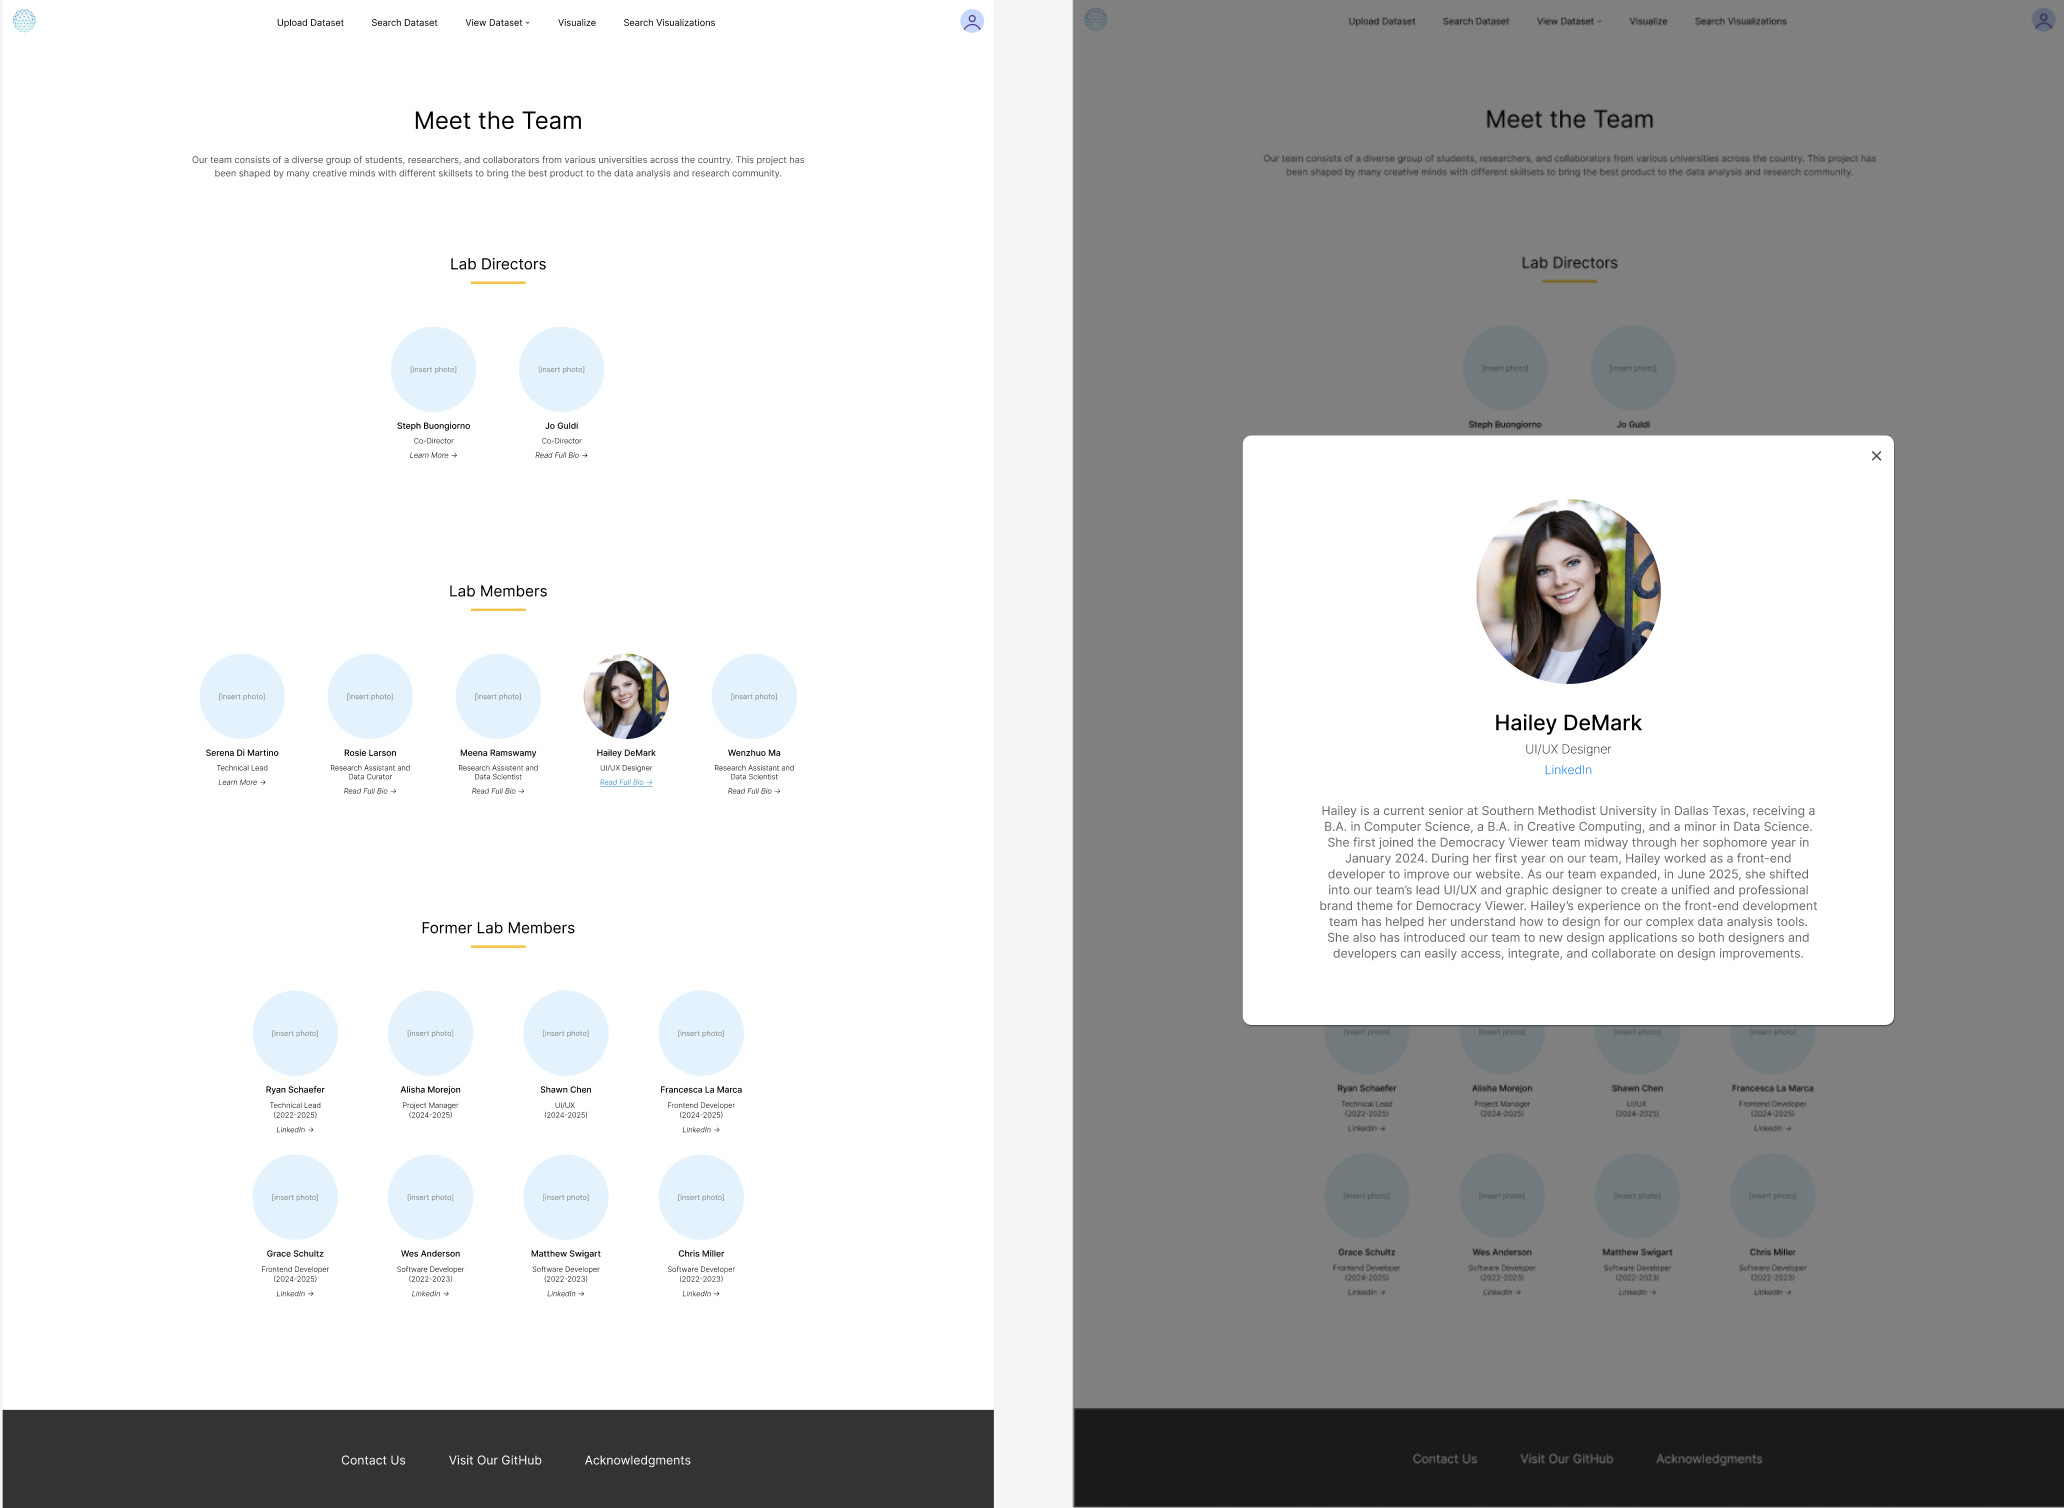
The Acknowledgements page celebrates the diverse team of students, researchers, and collaborators who have contributed to Democracy Viewer. Lab directors, current members, and former contributors are each listed with their role and tenure dates. Clicking any team member opens an expanded profile modal with a photo, bio, and LinkedIn link — giving proper credit to the people behind the platform while putting a human face on an otherwise data-driven tool.